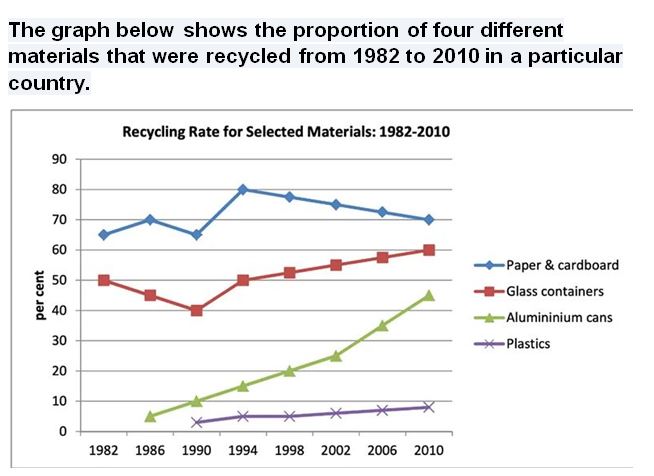
Band 5.0 Sample: The graph below shows the proportion of four different materials that were recycled from 1982 to 2010 in a particular country.
The representative graph provide the information about the recycled percentage of four different materials occurred in a particular region in between 1982 and 2010.
A glance is enough to make it clear that recycling rates for paper and cardboard wastes were quick high as compared to other materials. Though, the recycled proportion for plastics were the least one.
Coming to details, 65% of the paper and cardboard wastes recycled in 1982. Plus, there were fluctuations in recycling rates before reaching the peak of 80% in 1994. After then, the recycled rates decreased, rapidly and reached at the level of 70% in 2010.On the other hand, glass containers recycling rates were 50% in 1982. Though, these were slight drop in rates for next four year. But, after that, recycling rates rise upto 60% in 2010.
As far as, Aluminium cans and plastics wastes were concerned, for aluminium cans, the recycling rates were less than 10% in 1986. From 1990, the rates rose drastically, and reached above 40% in 2010. As per data, the recycling rates for plastics wastes remained under 10%, throughout the given time period.
Band 5.0 Sample: The graph below shows the proportion of four different materials that were recycled from 1982 to 2010 in a particular country.
Band Sample 5.0: The chart below shows the amount…
