There are many different types of music in the world today. Why do we need
There are many different types of music in the world today…

IELTS Writing Task 1 Bar Graph samples
Writing Module is the most important task for the preparation of the IELTS exam. It consist of 2 tasks. The writing task 1 and writing task 2. The duration of the writing task 1 is 20 minutes. It consist of data interpretation.
The bar graph is one of the data interpreting task of task 1. In this, bar graphs are given along with the information. Students have to assemble the information and have to write 150 t0 170 about it. The bars can be vertical as well as horizontal.
IELTS Writing Task 1 Bar Graph samples.
There are many different types of music in the world today. Why do we need

Band 7.0 Sample: The chart below shows the percentage of water used for different purposes

Band 6.5 Sample: The diagram below shows the life cycle of a species of large

Band 6.5 Sample: The charts below show what UK graduate and postgraduate students who did
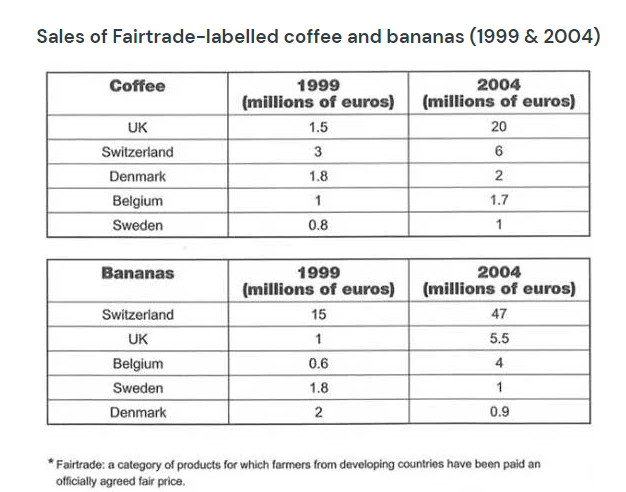
Band 7.0 Sample: The tables below give information about sales of Fairtrade*-labelled coffee and bananas

Band 8 Sample: The graph below gives information from a 2008 report about consumption of

Band 7.0 Sample: The chart below shows the total number of minutes (in billions) of

Band 7.0 Sample: The charts below give information on the ages of the populations of

Band 7 Sample: The chart below shows the number of households in the US by

Band 6.5 Sample: The chart shows the number of shops that closed and
You cannot copy content of this page