Band 5.5 Sample Answer: The chart below shows the number of… men and women (in thousand) in further education in Britain in three periods and whether they were studying full-time or part-time.
Summarize the information by selecting and reporting the main features, and make comparisons where relevant.
Write at least 150 words.
(This is solved Band 5 Sample Answer for the Writing Task one.)
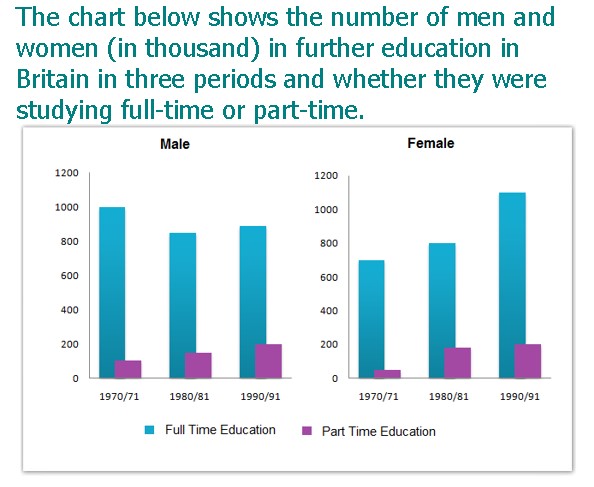
The representative chart provides the information about the number of males and females in the Great Britain in further education for three different time intervals. Plus, gives information about whether they were studying part time.
A glance is enough to make it clear that both the males and females were more interested in part time education. Additionally, part time education trend remain some throughout the given time period.
In the first year of 70’s, majority of the males were more interest in doing the first time education with clearly about 1000 numbers. Moreover, On the other hand, same trend were follow by females also with above 700 numbers.
In the starting of 90’s, highly preferable choice for part-time education was for female category with above 1000 numbers. Moreover, In this year, only around 200 numbers of men and women choose for full- time education.