Band 6.5 Sample: The graph below shows the number of tourists visiting a particular Caribbean island between 2010 and 2017.
Introductory Statement:
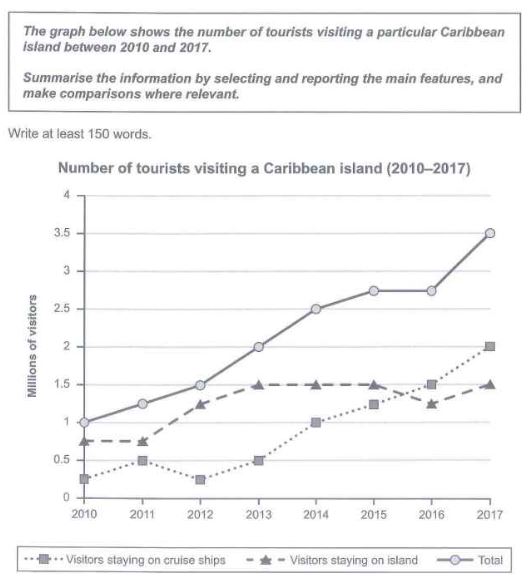
The given line chart demonstrates the number of people who visited a particular Caribbean Island for vocation from 2010 and 2017.
Overall Statement:
Overall, it is quite apparent that, the total number of tourists who visited the island has risen from 2010 to 2017. However, the number tourists who stayed on the cruise ships and tourists who opted to stay on island had fluctuation from initial point to find point.
Body Paragraph 1:
Moving on to the details, the total number of tourists increased from initial point to the final point from the year 2010 to 2017. The number of total tourists was 1 million in 2010 and increased gradually to 1.5 million in 2012. Then it increased to 2.7 million in 2015. It was constant till 2016 and then it increased drastically and reached 3.5 million in 2017. The tourists who stayed on island were about 0.7 million in the year 2010. It was constant till 2011 and then increased to 1.5 million in 2013.
Body Paragraph 2:
The number of visitors stayed on island was constant from 2013 to 2015 that was 1.5 million. Then it decreased to approximately 1.3 million in 2016. It ends up at 1.5 million in the final year. The number of tourists who stayed on cruise ships was nearly 0.3 million in the initial year. It increased to 0.5 million in 2011, and then it decreased to 0.3 million again in 2012. Then gradually it increased till the final year. The number was approximately 1.7 million in 2015 and 2 million in 2017.
Band 6.5 Sample: The graph below shows the number of tourists visiting a particular Caribbean island between 2010 and 2017.
Band 6.5 Sample: The maps below show the village of Stoke ford in 1930 and 2010.