Band 6 Sample Answer: The charts below show the levels of participation in education and science in developing and industrialized countries in 1980 and 1990.
Summarize the information by selecting and reporting the main features, and make comparisons where relevant.
Write at least 150 words.
(This is solved Band 6.0 Sample Answer for the Writing Task one.)
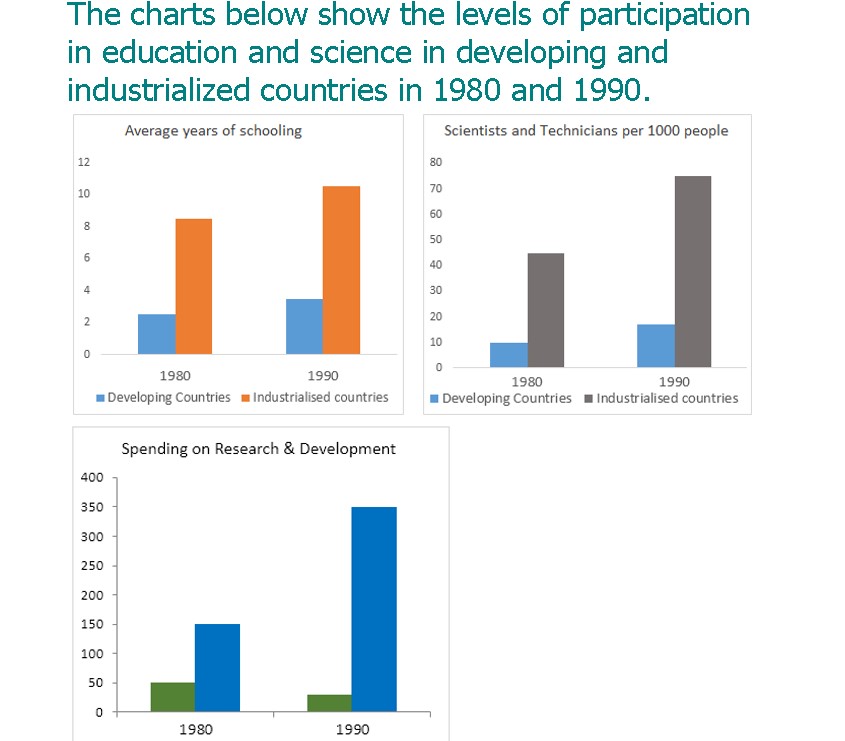
The representative bar charts provides the information about the participation levels in fields of education and science in developing and developed regions in two particular years that were 1980 and 1990.
A glance is enough to make it clear, that mostly in the industrialized countries major aspects like schooling, number of scientist or technicians and expenditures on research and development, were quite higher, as compared to the statics of developing countries.
Coming to details, in 1980, the average years of schooling were less than 3 years for developing countries. Moreover, in 1990, schooling average years had crossed the level of 3 years. Moreover the number of scientists and technicians in technical held were quite low in both years. Furthermore, developing countries spent around 50 billion and 25 billion on research and development in 1980 and 1990 respectively.
In contrast, average schooling years in developed nations were above 8 years. In 1980 and the average level of school had crossed 10 years in 1990. On the other hand, the number of scientists and technical persons were to per 100 people in 1990. Additionally, industrialized countries spent approximately 150 billions in 1980 and $350 billions in 1990 on research and development held.