Band 6.5 Sample: The charts below show what UK graduate and postgraduate students who did
Band 6.5 Sample: The charts below show what UK graduate and postgraduate students who did not go into full-time work did after leaving college in 2008.

IELTS Writing Task 1 answers.
Writing Module is very important for the preparation of the ielts exam. It holds much weight age and improve overall band score. Id includes two tasks. Task 1 and Task 2. In task 1, students have to interpret the data given in the task 1. And they to write a note of nearly 150 to 170 words about that. In task 2, students have to write the essay of 250 to 270 words.
Many students get confused in interpreting the data in the task 1. And they do not know how to write the correct information keeping the sentence structure correct. Here in this article, students can get all the information about the task 1 of the Writing Module. They can improve their overall band score and can get overall good band scores.
IELTS Writing Task 1 answers.

Band 6.5 Sample: The charts below show what UK graduate and postgraduate students who did

Band 6.5 Sample: The pie charts below show units of electricity production by fuel source

Band 6.5 Sample: The table below gives information about changes in modes of travel in

Band 6.5 Sample: The chart below shows the value of one country’s exports in various

Band 6.0 Sample: The chart below shows the value of one country’s exports in various

Band 6.5 Sample: The chart below shows the changes that took place in three different

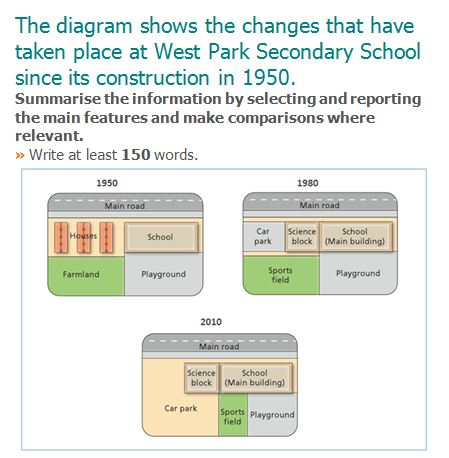
Band 6.0 Sample: The diagram shows the changes that have taken place at West Park

Band 6.0 Sample: The charts below give information on the ages of the populations of

Band 6.5 Sample: The table and charts below give information on the police budget for

Band 7.0 Sample: The two maps below show an island, before and after the construction
You cannot copy content of this page