Band 6.5 Sample: The diagram below shows the life cycle of a species of large
Band 6.5 Sample: The diagram below shows the life cycle of a species of large fish called the salmon.

IELTS Writing Task 1 Process Chart solved
Writing task is considered one of the most tasks. Task 1 is of 20 minutes. It consists of data interpretation. Various tasks are given in the task 1. Process chart is of the task of writing task. Process chart consist of different diagrams which students have to understand and write.
It can be natural life cycles or man made processes. It may included additional chains along with the cycles. As the cycles are often in circular shapes, students get confuse where to start and where to end the process.
Here, in this article all the techniques to writing the process chart properly are given with samples.
IELTS Writing Task 1 Process Chart solved
Band 6.5 Sample: The diagram below shows the life cycle of a species of large
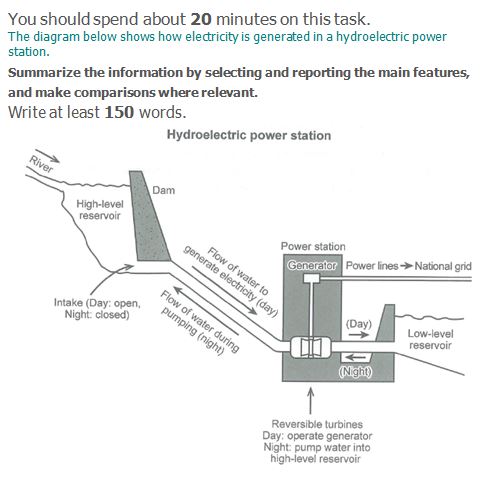
Band 6.5 Sample: The diagram below shows how electricity is generated in a hydroelectric power

Band 6.5 Sample: The diagram below shows the life cycle of a honey bee. Paraphrasing

Band 6 Sample: The diagram illustrates the Life Cycle process of frogs in a pond.

Band 6 Sample: The table below gives information about the underground railway systems in six
Band 5.5 Sample: The charts below show what UK graduate and postgraduate students who did

Band 6.0 Sample: The diagram below shows how geothermal energy is used to produce electricity.

Band 6.5 Sample: The charts below show what UK graduate and postgraduate students who did

Band 5.5 Sample: The chart below shows the results of a survey about people’s coffee

Band 5 Sample: The maps below show the centre of a small town called Islip
You cannot copy content of this page