
Band 5.0: The graph below shows the demand for electricity in England during typical days in winter and summer. The pie chart shows how electricity is used in an average English Home.
The graphical representation illustrate the demand for electricity in the country of Britain. During the winter and summer seasons. In addition to it, the pie chart described how the electricity is used in an individual houses.
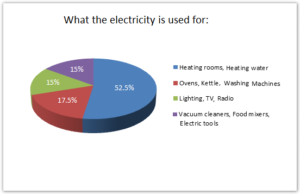
The demand of the electricity was quite high in the days of summer and it consumed huge amount of electricity units as compared to winter season. The huge chunk of electricity was used for the heating purpose of house. The area of lightning,Tv , radio and vacuum cleaners, food mixers, electric tools were shared the same amount of electricity used.
The requirement of electricity was more in the summer season which was around more than thirty thousand units. Night hours were used more electricity as compared to day hours. At night the usage of electricity units were just in between 40 and 50 thousand units.
On individual basis more electricity was consumed for heating rooms and heating water. Which was just above half percentage of total electricity used. The second highest percentage of usage was ovens kattles and washing clothes. The same amount of electricity is consumed for lighting and entertainment purpose as well as for cleaning, food mixers and electric tools which was above one tenth of total percentage.
Band 5.0: The graph below shows the demand for electricity in England during typical days in winter and summer. The pie chart shows how electricity is used in an average English Home.
Band 4.5 Sample: The charts below show the results…