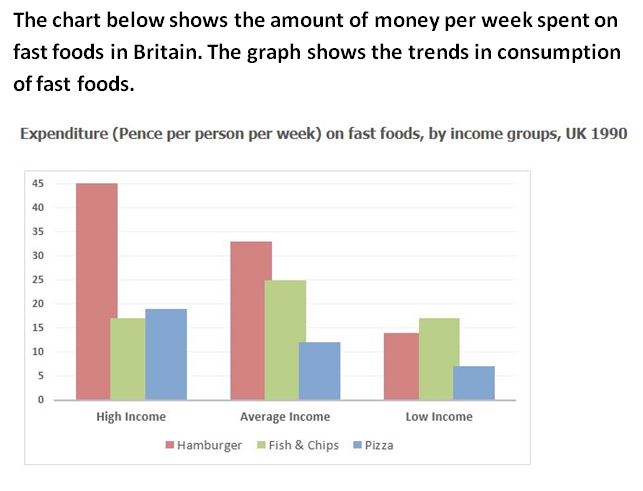
Band 6.5 Sample : The chart below shows the amount of money per week spent on fast foods in Britain. The graph shows the trends in consumption of fast foods.
Paraphrasing:
The Bar graph exhibits the sum of money in 7 days utilized on fast food in Britain. The Line graph illustrates the shifts in the intake of fast foods.
Overall Statement:
Looking at it in detail, as far as the expenditure on fast food by income groups is concerned, Fish and Chips showed an upward trend in Average income group as compared to the other groups. Whereas, the trends of Hamburger and Pizza were same which were declining. As far as the consumption of fast food (1970-1990) is concerned, the trend of Fish and chips was decreasing with passage of time in contrast to the similar trends of Hamburger and Pizza which was increasing.
Body Paragraph 1:
Talking about the Expenditure by different income groups, High income group utilised more than 15 pence per person per week on Fish and Chips which was almost same in the case of Low-income group as well. There was a sudden increase in the utilization by average income group for Fish and chips in which 25 pence per person per week was utilized. More than 40 pence per person per week and almost 20 pence per person per week were used by High income group for Hamburgers and Pizza. It declined steadily to around 35 pence per person per week and approximately 10 pence per person per week in case of Average income group. Further, it decreased about 15 pence per person per week and less than 10 pence per person per week in low income group respectively.
Body paragraph 2:
Detailing the consumption of fast food for 20 years from 1970, Fish and chips were consumed around 300 grams which decreased to 200 grams in 1985 and ultimately it rose few grams in 1990. The trends of Hamburger and Pizza are same as they both started below 100 grams in 1970 and showed steady growth till 1990 which is above 500 grams in case of former and around 300 in case of latter.
Band 6.5 Sample : The chart below shows the amount of money per week spent on fast foods in Britain. The graph shows the trends in consumption of fast foods.
