Band 7 Sample: The table below gives information about changes in modes of travel in England between 1985 and 2000.
The Chart illustrates the data about alterations in the ways of transport in England between 1985 and 2000.
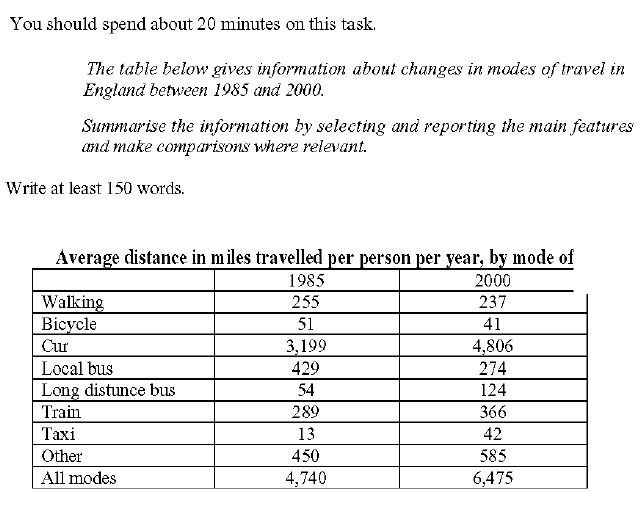
Looking at it precisely, it is crystal clear that in the time span of 15 years, the travelling through walking, bicycles, and Local Bus decreased whereas use of Car, long distance bus, train, taxi and other modes increased. Overall, the miles travelled by summing up all modes of travel increased.
Detailing about the modes of travel which decreased with passage of time, travelling through walking changed from 255 miles to 237 miles. In case of Bicycles, it decreased from 51 miles to 41 miles. Looking at the trend of Local Bus, it declined drastically
from 429 miles to 274 miles.
Talking about the ways of transport which increased, there is sharp increase in the use of car from 3199 miles to 4806 miles. Similarly, travelling through long distance bus rose from 54 miles to 124 miles. Miles travelled through train and taxi increased from 289 miles to 366 miles and 13 miles to 42 miles respectively. Finally, travelling through other modes of travel also increased which were 450 miles in 1985 to 585 miles in 2000.
Band 7 Sample: The table below gives information about changes in modes of travel in England between 1985 and 2000.