Band Sample 5.0: The graph and table below show the average monthly temperatures and the average number of hours of sunshine per year in three major cities.
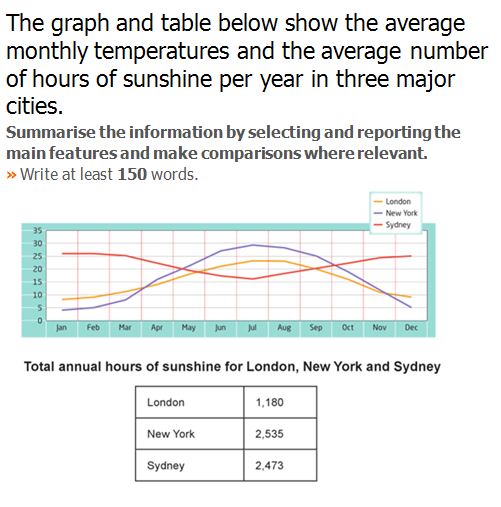
The representative line graph provides the information about the average monthly temperature. While, the total illustrates the average number of hours of sunshine in a year. These statistics are from three cities which are London, New York and Sydney.
A Glance is enough, which makes it clear that the temperature levels also quite higher in starting and ending months of year in London. Levels of temperature are in the mid six months of a year. The total annual hours of sunshine are law for London as compared to other two cities.
Coming to details, in Sydney the temperature levels are above 25degree c in initial and final two months. But, in New York and Sydney, the trend opposite where in both cities, the Temperature levels are starting from 5-10 degree in January with the passage of months, the levels are increased reach at peak of 30-degree c in July. After that levels also dropped drastically and come below 10-degree c for both cities in December.
As for as sunshine hours are concerned, London city has levels annual hours of sunlight that are 1180 hours. On the other hand, in New York city the annual hours of sunshine are 2535, which are higher then 2473 hours of Sydney.
Band Sample 5.0: The graph and table below show the average monthly temperatures and the average number of hours of sunshine per year in three major cities.
Band Sample 4.5: The table below shows sales…