Band Sample 5.5: The graph below shows the total value exports and the value of fuel, food and manufactured goods exported by one country from 2000 to 2005.
Paraphrasing:
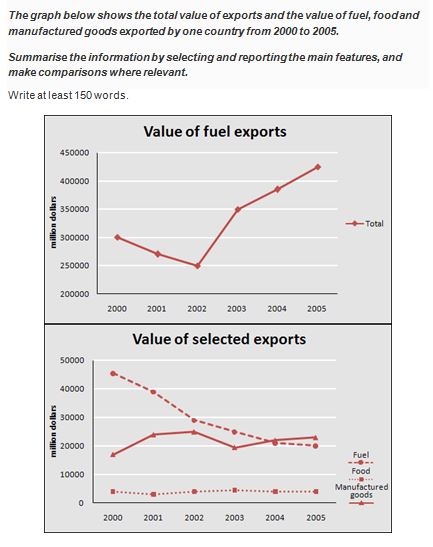
The representative initial line graph provides the information about the total value of fuel exports. And others graphs illustrates the total value of selected exports such as fuel, food and manufactured goods. The statistics is for one particular nation in between 2000 and 2005.
Overall statement:
A glance is enough, which makes it clear that exports value of fuel was quite low in initial years as compared to final years. While, the exports values of fuel and food items were higher and the exports of manufactured goods was stable in all years.
Body-paragraph 1:
Coming to details, around 300,000 million dollars were being spent on the exports of fuel in 2000. After 2000 in upcoming to years, the fuel exports value dropped at the level of 250,000. Surprisingly, in next three years the exports growth of fuel increased drastically and reached at the peak of 400,000 million dollars 2005.
Body-paragraph 2:
As per as, the value of selected exports things are concerned, approx. 45,000 million dollars were being used on exporting fuel in 2000. However, the export value of fuel was decreased constantly in next five years and only 20,000 million dollars had been used on the export of fuel in 2005. On the other hand, food exports value had been fluctuating’s simultaneously. Whilst, the export of manufactured products was quite stable in all mentioned years. And the value remained under 10,000 million dollars.
Band Sample 5.5: The graph below shows the. total value exports and the value of fuel, food and manufactured goods exported by one country from 2000 to 2005.
Band Sample 6.0: The charts below give information about weather in two Brazilian cities.