Band Sample 6.0: The charts below give information about weather in two Brazilian cities.
The information charts provide the information about deferent rainfall intensities and temperature changes in two cities of Brazil named as Brasília and recipe.
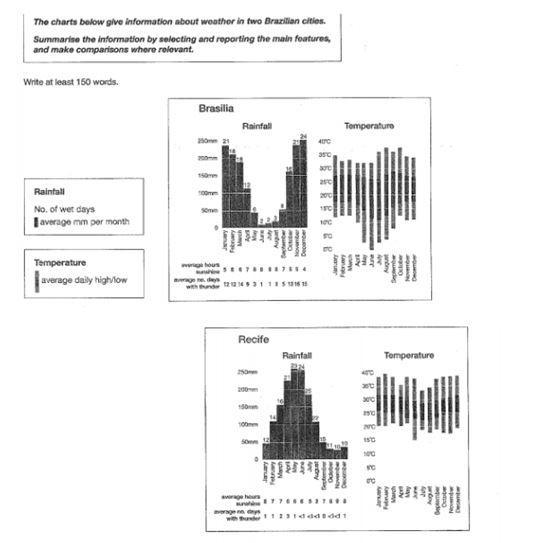
A glance is enough, which makes it clear that rainfall occurring is very high in starting and ending months of year in Brasilia and similarly, the temperature is also at same level in these years. Whereas, in recipe rainfall occurring is quite higher in mid of the year. As compared first and last few months. But the temperature levels are almost similar throughout the year.
Coming to details, in Brasilia city, the rainfall statics are above 150mm in first and last three months of year and from May to august the intensity is below 50mm. According to the data July month has highest average hours of sunshine and that also 9 hours. As per as, temperature level are concerned the average. Daly level of temperature also in between 30c-45c in all month.
In recipe city rainfall precipitation is at the level of 50mm in January after that, the level are increasing up to 250mm in may and from June. The levels are dropping consistently and reach at 50mm rainfall in last four months. The temperature variation are quite similar in all months. Where average law temperature is in between 15-20 Degree and high temperature in range of 30–45-degree c.
Band Sample 6.0: The charts below give information about weather in two Brazilian cities.
Band Sample 5.0: The graph and table below show the…