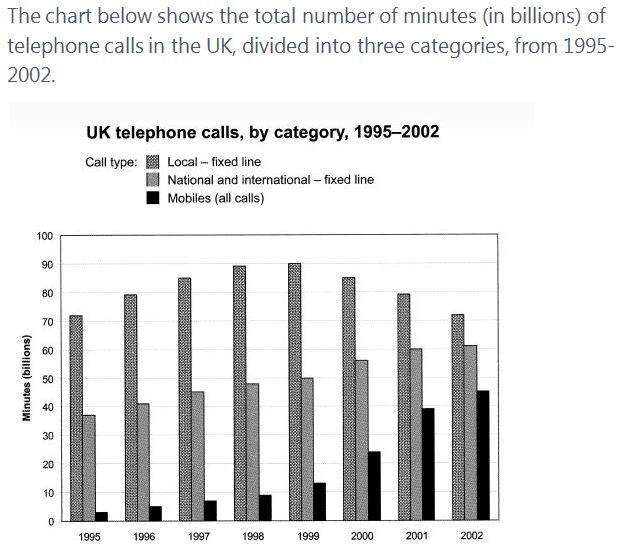
Band Sample 6.0:The chart below shows the total number of minutes (in billions) of telephone calls in the UK, divided into three categories, from 1995-2002.
The representative bar chart provides the information about telephonic conversation through the call types, named as local, national or international and mobile calls. The statical data had collected from the United Kingdom in between 1995 and 2002.
A glance is enough to make it clear that a chunk of phone calls had used for local purpose. Despite this, the use of natural and international calls had increased with the passage of time. Plus, negligible amount of minutes had consumed for telephonic conversations through mobile phones.
Coming to details, in 1995, around 72 billion of minutes were being used by the people for local calls. For next 4 years, the numbers had increased constantly. As a result of this, in 1999, the statics for local calls reached the milestone of 90 billion minutes. But, in the first two years of 21st century, the level of numbers had decreased approximately by 10 billion minutes.
On the other hand, national and international calls consumptions were below 40 billion minutes in 1995. But, the usage of these calls increased constantly throughout the given time period. As far as mobile phone consumptions were concerned, from 1995 to 1998, the use of mobile was minor. But, the statics of mobile use got pace from 2000 onwards.
Band Sample 6.0:The chart below shows the total number of minutes (in billions) of telephone calls in the UK, divided into three categories, from 1995-2002.
Band Sample 6.0: The graph below shows the…