Band 6.5 Sample: The table below gives information about changes in modes of travel in
Band 6.5 Sample: The table below gives information about changes in modes of travel in England between 1985 and 2000.

IELTS Writing Task 1 band 9.
Writing Module very important for the ielts exam. Many students find it difficult to score good in this module because they do not have content to write about it. Or they find it difficult to remember the format of the Writing task.
Here in this article, students can get idea about how to paraphrase the given statement, how to write an appropriate overall statement and how to divide the content into two body paragraphs. Solved sample papers are available with proper explanation for the beginners. So that they follow the instruction properly. And can improve their band scores in writing module.
IELTS Writing Task 1 band 9.
Band 6.5 Sample: The table below gives information about changes in modes of travel in

Band 6.5 Sample: The chart below shows the value of one country’s exports in various

Band 6.0 Sample: The chart below shows the value of one country’s exports in various

Band 6.5 Sample: The chart below shows the changes that took place in three different
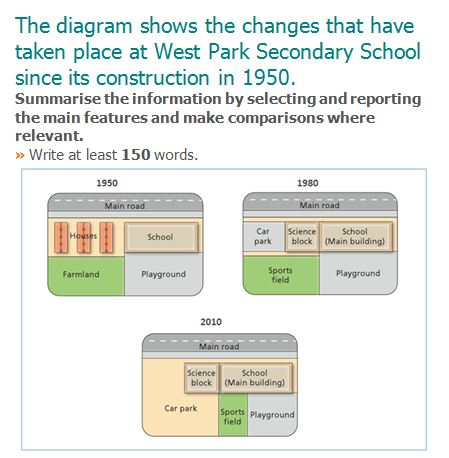
Band 6.0 Sample: The diagram shows the changes that have taken place at West Park

Band 6.0 Sample: The charts below give information on the ages of the populations of

Band 6.5 Sample: The table and charts below give information on the police budget for

Band 7.0 Sample: The two maps below show an island, before and after the construction
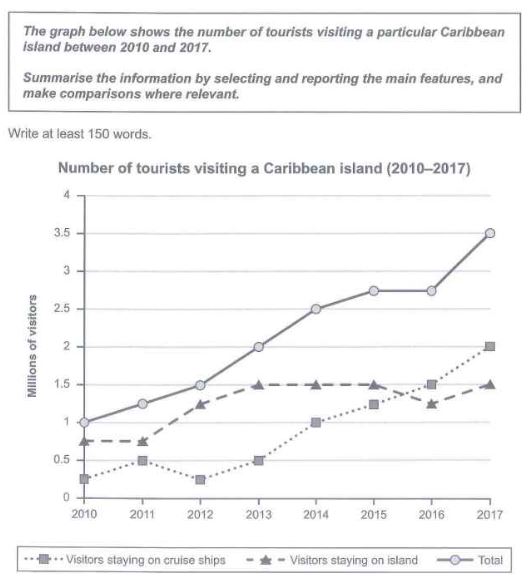
Band 6.5 Sample: The graph below shows the number of tourists visiting a particular Caribbean

Band 6.5 Sample: The maps below show the village of Stoke ford in 1930 and
You cannot copy content of this page