Band 6.5 Sample: The charts below show what UK graduate and postgraduate students who did
Band 6.5 Sample: The charts below show what UK graduate and postgraduate students who did not go into full-time work did after leaving college in 2008.

IELTS Writing Task 1 Table
Writing module is very important for the preparation of the ielts exam. It consist of Task 1 and Task 2. The duration of the Task 1 is 20 minutes. In this task, students have to interpret data and write a note on it. Table is one of the tasks of Writing Task 1.
In this task, students are given with the table with the information. And students have to understand the details and write about it in 150 to 170 words.
Students often get confused in the division of the content. How to paraphrase the statement and how much information should be written in the overall statement. Here in this study material, students are get idea about all the things. And they can score bands in writing module.
IELTS Writing Task 1 Table.

Band 6.5 Sample: The charts below show what UK graduate and postgraduate students who did

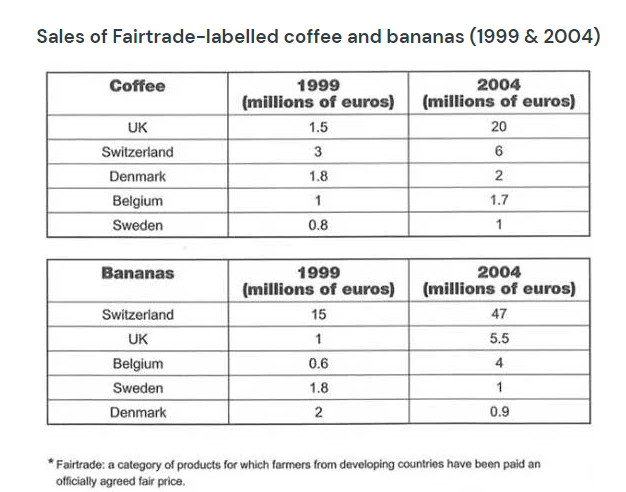
Band 7.0 Sample: The tables below give information about sales of Fairtrade*-labelled coffee and bananas

Band 6.5 Sample: The pie chart below shows the main reasons why agricultural land becomes

Band 6.5 Sample: The table below gives information about changes in modes of travel in

Band 6.5 Sample: The table and charts below give information on the police budget for

Band 6.0 Sample: The graph and table below give information about water use worldwide and

Band 6 Sample: The graph and table below show the average monthly temperatures and the

Band 5 Sample: Percentage of business with a social media presence. Introductory Statement: The given

Band 6 Sample: The table below gives information about the underground railway systems in six

Band 5.5 Sample: The charts below show what UK graduate and postgraduate students who did
You cannot copy content of this page