Band 5.5 Sample: The first chart below shows how energy is used in an average Australian household. The second chart shows the greenhouse gas emissions which result from this energy use.
Paraphrasing Statement:
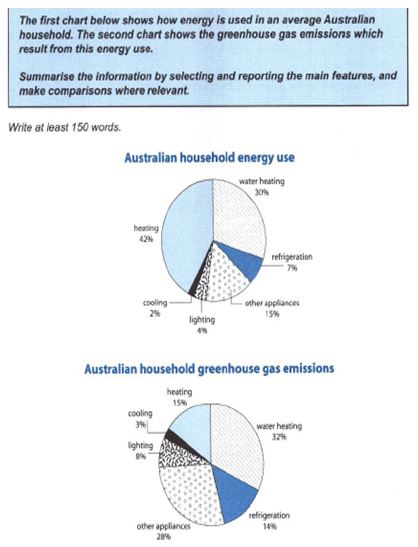
The former pie chart exhibits the use of energy in an average household of Australia. Secondly, the latter circular chart details the emissions of greenhouse gasses which consequence from this use of energy.
Overall Statement:
Overall it is clear that, largest chunk of energy is used for heating whereas use of energy is done for cooling in average Australian household. As far as the Green House Gases is concerned, largest amount of gas is released during water heating and lowest amount of gas is released in case of Cooling.
Body Paragraph 1:
To start with, the use of energy in an average household of Australia, 42 percent of energy which is highest of all is used for heating. This is followed by water heating for which 30 percent of energy is used. Further, this percentage gets halved in case of other appliances for which 15 percent of energy is used. Moreover, in reference to refrigeration, lightening and cooling the use of energy has been 7 percent, 4 percent and 2 percent respectively.
Body Paragraph 2:
Elaborating the emissions of Green Houses Gases by Australian Household, most of them is done by water heating which is 32 percent. Moreover, 28 percent of the emissions happen through other appliances. Furthermore, heating and Refrigeration contributes 15 percent and 14 percent of the emissions as well. Also, least of the emissions is there in context of lighting and cooling which are 8 percent and 3 percent respectively of the total emissions.
Band 5.5 Sample: The first chart below shows how energy is used in an average Australian household. The second chart shows the greenhouse gas emissions which result from this energy use.