Band 7 Sample: The graph below shows the average monthly change in the prices of
Band 7 Sample: The graph below shows the average monthly change in the prices of three metals during 2014.

IELTS Writing Task 1 band 9.
Writing Module very important for the ielts exam. Many students find it difficult to score good in this module because they do not have content to write about it. Or they find it difficult to remember the format of the Writing task.
Here in this article, students can get idea about how to paraphrase the given statement, how to write an appropriate overall statement and how to divide the content into two body paragraphs. Solved sample papers are available with proper explanation for the beginners. So that they follow the instruction properly. And can improve their band scores in writing module.
IELTS Writing Task 1 band 9.
Band 7 Sample: The graph below shows the average monthly change in the prices of

Band 7.0 Sample: The diagram below shows the floor plan of a public library 20

Band 7 Sample: The chart below shows the number of households in the US by

Band 7 Sample: The graph below gives the information about the percentage of the population

Band 6.0 Sample: The graph below shows the consumption of fish and some different kinds

Band 6.5 Sample: The chart shows the number of shops that closed and

Band 6.5 Sample: The charts below give information about USA marriage and divorce rates between
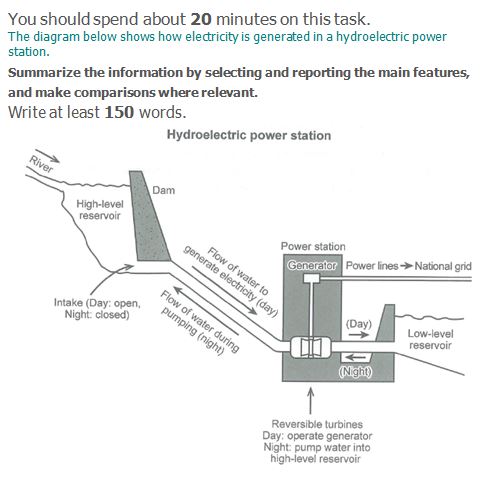
Band 6.5 Sample: The diagram below shows how electricity is generated in a hydroelectric power

Band 6.5 Sample: The charts below show what UK graduate and postgraduate students who did

Band 6.5 Sample: The pie charts below show units of electricity production by fuel source
You cannot copy content of this page