Band 7.0 Sample: The chart below shows the percentage of water used for different purposes
Band 7.0 Sample: The chart below shows the percentage of water used for different purposes in six areas of the world.

IELTS Writing Task 1 Cambridge.
Writing Module is very important for the preparation of the ielts exam. It consist of Task 1 and Task 2. The criteria for the checking of writing task are task achievement, coherence and cohesion, lexical resource and grammatical range and accuracy.
Here in this article, all the task 1 from the Cambridge books are given with solved sample answers. All the tricks and tips to the write the task 1 of the writing module are given. With proper paraphrasing and overall statement. The proper division of the content in BP 1 and BP 2 is present.
IELTS Writing Task 1 Cambridge.

Band 7.0 Sample: The chart below shows the percentage of water used for different purposes

Band 6.5 Sample: The diagram below shows the life cycle of a species of large

Band 6.5 Sample: The charts below show what UK graduate and postgraduate students who did

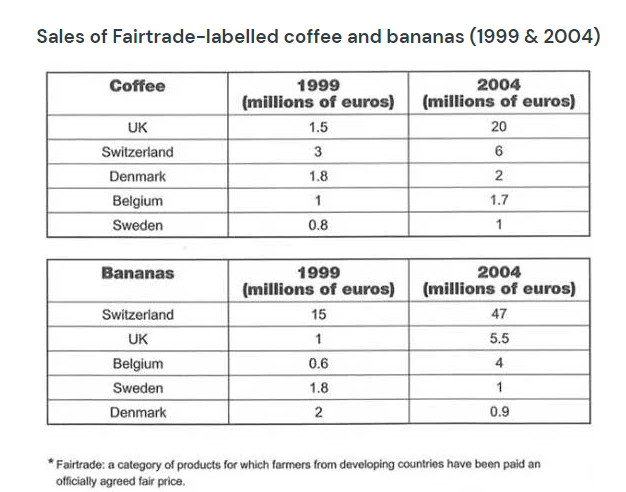
Band 7.0 Sample: The tables below give information about sales of Fairtrade*-labelled coffee and bananas

Band 8 Sample: The graph below gives information from a 2008 report about consumption of

Band 7.0 Sample: The chart below shows the total number of minutes (in billions) of

Band 7.0 Sample: The charts below give information on the ages of the populations of

Band 7.0 Sample: The given maps describe the information about the changes that are made

Describe a piece of good news you heard from others. Introduction- I have heard much

Band 7.0 Sample: The graph below shows the demand for electricity in England during typical
You cannot copy content of this page