Band 6.0 Sample: The diagram below shows how geothermal energy is used to produce electricity.
Band 6.0 Sample: The diagram below shows how geothermal energy is used to produce electricity.

IELTS Writing Task 1 Map Solved Samples.
Writing Module is considered the most important of all the modules in IELTS exam. It is rather very difficult to understand. According to some students, Maps are the hardest to solve. It is difficult for them to divide the map in two body paragraphs.
Here in this article, Students can get proper idea of maps. They can learn about the common mistakes which they make during the preparation. Students can get idea about the paraphrasing of the statement and overall statements. A explanation about how to use direction and how to understand signs given on the map.
IELTS Writing Task 1 Map Solved samples.

Band 6.0 Sample: The diagram below shows how geothermal energy is used to produce electricity.

Band 6.5 Sample: The pie charts below show the online sales for retail sectors in

Band 6 Sample: The tables below give information about sales of Fairtrade-labelled coffee and bananas

Band 6 Sample: The pie charts below show the online shopping sales for retail sectors

Band 5.0 Sample: The chart below shows the annual number of rentals and sales (in

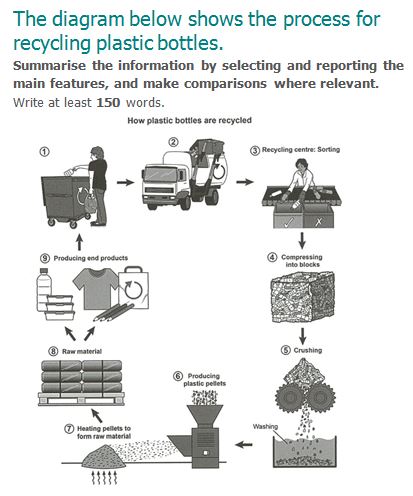
Band 5 Sample: The diagram below shows the process for recycling plastic bottles. Paraphrasing Statement:

Band 5.5 Sample: The graph below shows the demand for electricity in England during typical

Band 5 Sample: The maps below show the centre of a small town called Islip

Band 5.5 Sample: The diagram below shows the manufacturing process for making sugar from sugar

Band 5.0 Sample: The graph below shows the proportion of the population aged 65 and
You cannot copy content of this page