Band Sample 5: The charts below give information about USA marriage and divorce rates between 1970 and 2000, and the marital status of adult Americans in two of the years.
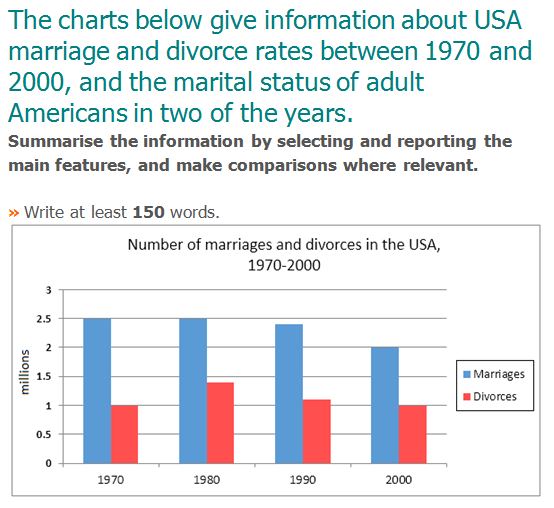
The representative chart provides the information about the numbers of marriage and divorce rates in the United States of America from 1970 to 2000. While other hand chart illustrates the natural states of America adults in two separate years.
A glance is enough, which makes it clear that numbers of marriages has increased in 90’s and 20’s. But divorce rates had been fluctuating in the given time period. Whereas most of the American were married in 1970 and 2000.
Coming to details, from `1970 to 1980, the marriage rates were 2.5 million. In the last 10 years of 20th century, the rates had been decreased slightly with 0.5 million till 2000. On the other hand, divorce rates were seen with fluctuation throughout the given years. Were in 1970, thew number of divorce were 1 million. After that, there was 0.4 million in following ten years. However, again the level of divorces number at I million in 2000.
As for as, marital states of American adults is concerned, majority of the adults got married in 1970 and 2000. But only, 15% of adults were unmarried in 1970 and these rates of unmarried percentage of adults which come under widowed and divorce categories.
Band Sample 5: The charts below give information about USA marriage and divorce rates between 1970 and 2000, and the marital status of adult Americans in two of the years.
Band 5.0: The charts below give information on the ages…