Band 7.0 Sample: The chart below shows the percentage of water used for different purposes
Band 7.0 Sample: The chart below shows the percentage of water used for different purposes in six areas of the world.

IELTS Writing Task 1 answers.
Writing Module is very important for the preparation of the ielts exam. It holds much weight age and improve overall band score. Id includes two tasks. Task 1 and Task 2. In task 1, students have to interpret the data given in the task 1. And they to write a note of nearly 150 to 170 words about that. In task 2, students have to write the essay of 250 to 270 words.
Many students get confused in interpreting the data in the task 1. And they do not know how to write the correct information keeping the sentence structure correct. Here in this article, students can get all the information about the task 1 of the Writing Module. They can improve their overall band score and can get overall good band scores.
IELTS Writing Task 1 answers.
Band 7.0 Sample: The chart below shows the percentage of water used for different purposes

Band 6.5 Sample: The diagram below shows the life cycle of a species of large

Band 6.5 Sample: The charts below show what UK graduate and postgraduate students who did
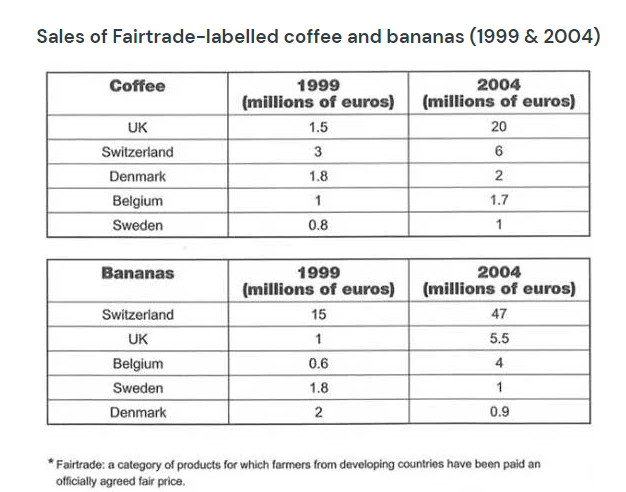
Band 7.0 Sample: The tables below give information about sales of Fairtrade*-labelled coffee and bananas

Band 7.0 Sample: The two pie charts represent the use of energy in various segments

Band 8 Sample: The graph below gives information from a 2008 report about consumption of

Band 7.0 Sample: The chart below shows the total number of minutes (in billions) of

Band 7.0 Sample: The charts below give information on the ages of the populations of

Band 7.0 Sample: The given maps describe the information about the changes that are made

Band 7.0 Sample: The graph below shows the demand for electricity in England during typical
You cannot copy content of this page