Band Sample 5.0: The table below shows the figures for imprisonment in five countries between
Band Sample 5.0: The table below shows the figures for…

IELTS Writing Task 1 Line Graph.
Writing task 1 is consist of data interpretation. It is of various types, Bar graphs, Line graphs, Multiple Graphs, Pie charts and Table.
In line graph, various lines are given, representing the different data. The lines can be straight or curved. Students have to understand it and write a report on it. It is very useful for the beginners as well as other students. Students can get idea about the task.
Here, in the article, students can get idea of paraphrasing the statement and overall statement. Moreover, students can get idea about the division of data which is to be written in BP1 and BP2.
IELTS Writing Task 1 Line Graph.

Band Sample 5.0: The table below shows the figures for imprisonment in five countries between

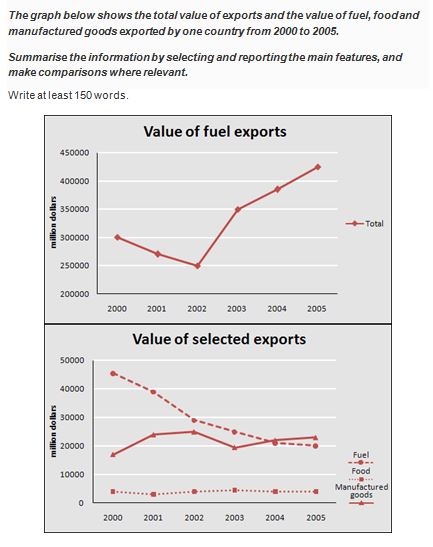
Band Sample 5.5: The graph below shows the total value exports and the value of

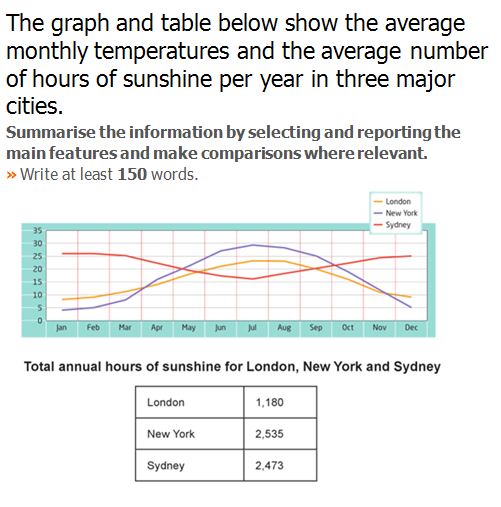
Band Sample 5.0: The graph and table below show the average monthly temperatures and the

Band Sample 4.5: The graph below shows the consumption of fish and some different kinds

Band Sample 4.5: The bar chart below shows the percentage of Australian men and women

Band Sample5.0 : The charts below show the percentage of food budget the average family

Band 5.0: The charts below give information on the ages of the populations of Yemen and Italy

Band 4.5 Sample Answer: Eating sweet foods produces acid in the mouth, which can cause

Band 5 Sample Answer: The chart below shows the number of men and women (in thousand)

Band 5.5 Sample Answer: The graphs below show the numbers of male and female workers
You cannot copy content of this page