Band 7.0 Sample: The chart below shows the percentage of water used for different purposes
Band 7.0 Sample: The chart below shows the percentage of water used for different purposes in six areas of the world.

IELTS Writing Task 1 Pie Chart.
Writing Module is the most important of all the modules. Many students find it difficult to score good band scores in the Writing task. Writing task consist of task 1 and task 2. The duration of the task 1 is 20 minutes. It consist of pie charts, line graphs, bar graphs, maps and processes.
Here in this article, pie charts of the task 1 are discussed with paraphrasing and overall statement. Usually, 2, 3 or 4 pie charts are given. And they often interpret the same data. Students often get confused in the division of the content in BP 1 and BP 2.
IELTS Writing Task 1 Pie Chart.
Band 7.0 Sample: The chart below shows the percentage of water used for different purposes
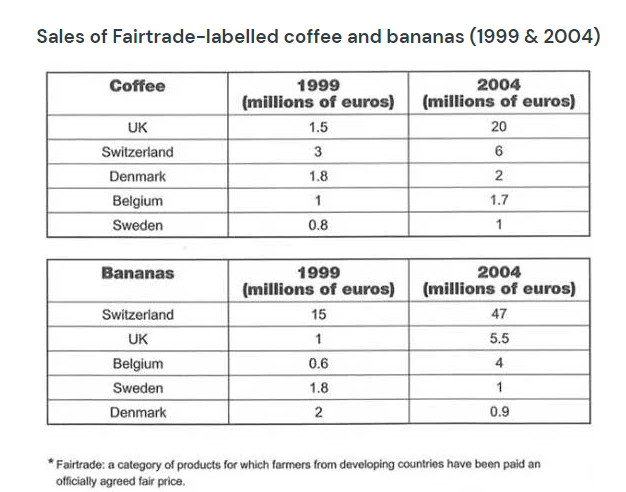
Band 7.0 Sample: The tables below give information about sales of Fairtrade*-labelled coffee and bananas

Band 7.0 Sample: The two pie charts represent the use of energy in various segments

Band 7.0 Sample: The graph below shows the demand for electricity in England during typical

Band 6.5 Sample: The pie chart below shows the main reasons why agricultural land becomes

Band 6.5 Sample: The pie charts below show units of electricity production by fuel source

Band 6.0 Sample: The charts below give information on the ages of the populations of

Band 6.5 Sample: The table and charts below give information on the police budget for

Band 5.5 Sample: The three pie charts below show the changes in annual spending by

Band 5 Sample: Percentage of business with a social media presence. Introductory Statement: The given
You cannot copy content of this page