Band 6.5 Sample: The charts below show what UK graduate and postgraduate students who did
Band 6.5 Sample: The charts below show what UK graduate and postgraduate students who did not go int full-time work did after leaving college in 2008.

IELTS Writing Task 1 tips
Writing Module is very important for the ielts preparation. Many students find it difficult to score good in writing task. They find difficulty in forming correct sentence structure. They find it difficult to interpret the data and keep sentence structure correct.
So in this article, all the tips and tricks are given for the better performance of the students. They can learn everything about the task 1 and can improve their band scores. Proper explanation of the paraphrasing and proper format of the overall statement is given. All the possible solved sample papers are of the task 1.
IELTS Writing Task 1 tips.

Band 6.5 Sample: The charts below show what UK graduate and postgraduate students who did

Band 6.5 Sample: The pie charts below show the online sales for retail sectors in

Band 6 Sample: The tables below give information about sales of Fairtrade-labelled coffee and bananas

Band 5.0 Sample: The chart below shows the annual number of rentals and sales (in

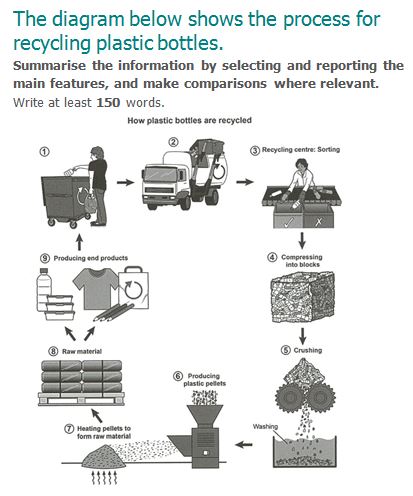
Band 5 Sample: The diagram below shows the process for recycling plastic bottles. Paraphrasing Statement:

Band 5.5 Sample: The graph below shows the demand for electricity in England during typical

Band 5 Sample: The maps below show the centre of a small town called Islip

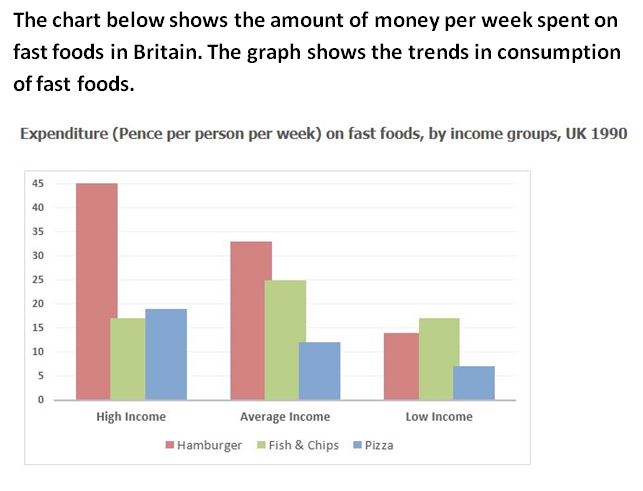
Band 6.5 Sample : The chart below shows the amount of money per week spent

Band 5.5 Sample: The diagram below shows the manufacturing process for making sugar from sugar

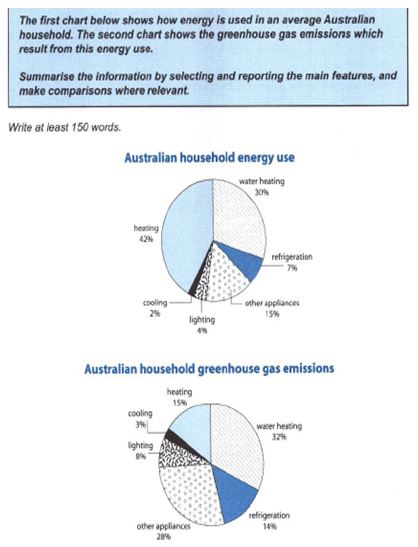
Band 5.5 Sample: The first chart below shows how energy is used in an average
You cannot copy content of this page