Band 7 Sample: The graph below shows the average monthly change in the prices of
Band 7 Sample: The graph below shows the average monthly change in the prices of three metals during 2014.

IELTS Writing Task 1 is very important part of the IELTS Exam. It has Seven types which are Bar Chart, Line Graph, Table, Pie Chart, Process Diagram, Map and Multiple Graphs.
Here, students are supposed to detail the trends and other aspects which is essential part of the whole Paper. These Questions are very easy. They are for to check the understanding of the students.
Apart from this, emphasis is laid on the grammar and the lexical aspects of the answers. Moreover, the cohesion which is very important for the writing module of IELTS Exam is given most priority and attention.
IELTS Writing Task 1
Band 7 Sample: The graph below shows the average monthly change in the prices of

Band 7.0 Sample: The diagram below shows the floor plan of a public library 20

Band 7 Sample: The chart below shows the number of households in the US by

Band 7 Sample: The graph below gives the information about the percentage of the population

Band 6.5 Sample: The pie chart below shows the main reasons why agricultural land becomes

Band 6.0 Sample: The graph below shows the consumption of fish and some different kinds

Band 6.5 Sample: The chart shows the number of shops that closed and

Band 6.5 Sample: The charts below give information about USA marriage and divorce rates between

Band 6.5 Sample:The charts below give information about travel to and from the UK, and
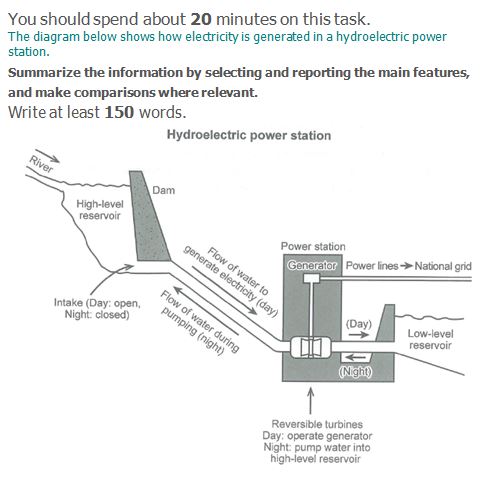
Band 6.5 Sample: The diagram below shows how electricity is generated in a hydroelectric power
You cannot copy content of this page