Band 6.5 Sample: The graph below shows the number of tourists visiting a particular Caribbean
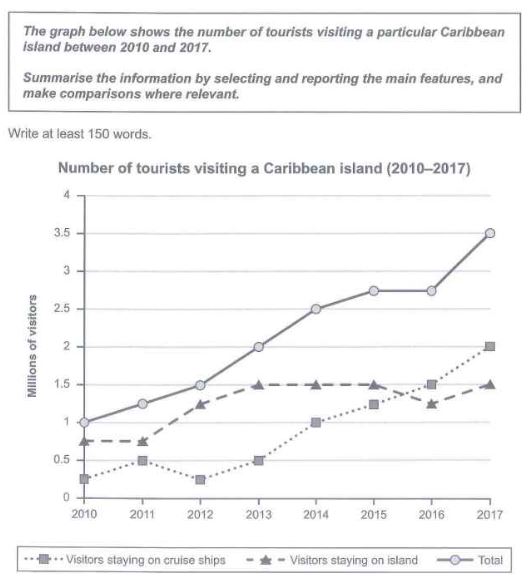
Band 6.5 Sample: The graph below shows the number of tourists visiting a particular Caribbean island between 2010 and 2017.
IELTS Writing Task 1 is very important part of the IELTS Exam. It has Seven types which are Bar Chart, Line Graph, Table, Pie Chart, Process Diagram, Map and Multiple Graphs.
Here, students are supposed to detail the trends and other aspects which is essential part of the whole Paper. These Questions are very easy. They are for to check the understanding of the students.
Apart from this, emphasis is laid on the grammar and the lexical aspects of the answers. Moreover, the cohesion which is very important for the writing module of IELTS Exam is given most priority and attention.
IELTS Writing Task 1
Band 6.5 Sample: The graph below shows the number of tourists visiting a particular Caribbean

Band 6.5 Sample: The maps below show the village of Stoke ford in 1930 and

Band 6.5 Sample: The diagram below shows the life cycle of a honey bee. Paraphrasing

Band 6.5 Sample: The two maps below show road access to a city hospital in

Band 6.0 Sample: The graph and table below give information about water use worldwide and

Band 5.5 Sample: The charts below show the number of Japanese tourists travelling abroad between

Band 5.5 Sample: The chart below shows the different levels of post-school qualifications in Australia

Band 5.5 Sample: The three pie charts below show the changes in annual spending by

Band 5.5 Sample: The graph below shows the unemployment rates in the US and Japan

Band 6 Sample: The diagram illustrates the Life Cycle process of frogs in a pond.
You cannot copy content of this page