Band 6.0 Sample: The table below gives information about the underground railway systems in the
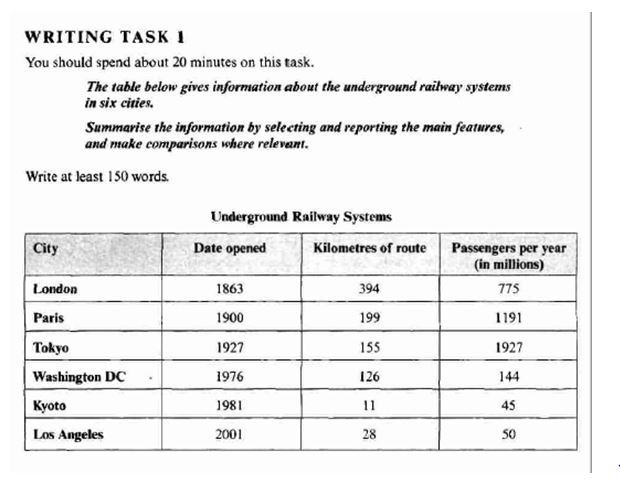
Band 6.0 Sample: The table below gives information about the underground railway systems in the six cities.
IELTS Writing Task 1 is very important part of the IELTS Exam. It has Seven types which are Bar Chart, Line Graph, Table, Pie Chart, Process Diagram, Map and Multiple Graphs.
Here, students are supposed to detail the trends and other aspects which is essential part of the whole Paper. These Questions are very easy. They are for to check the understanding of the students.
Apart from this, emphasis is laid on the grammar and the lexical aspects of the answers. Moreover, the cohesion which is very important for the writing module of IELTS Exam is given most priority and attention.
IELTS Writing Task 1
Band 6.0 Sample: The table below gives information about the underground railway systems in the

Band 5.0 Sample: The graph below shows the proportion of the population aged 65 and

Band 5.0 Sample: The charts below show the number of Japanese tourists travelling abroad between
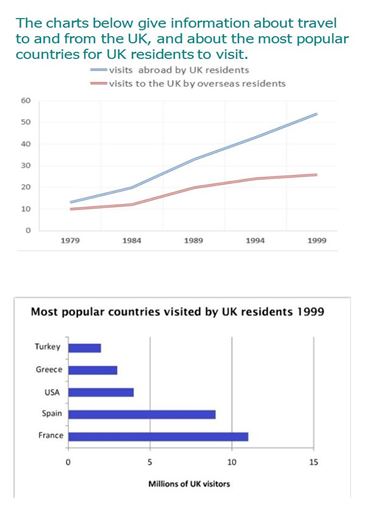
Band 5.5 Sample: The charts below give information about travel to and from the UK,
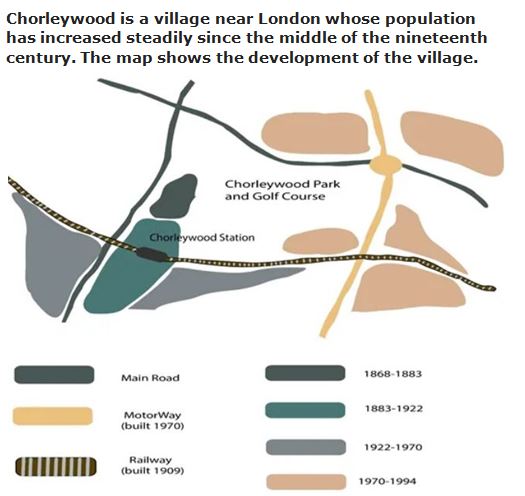
Band 5.0 Sample: Chorleywood is a village near London whose population has increased steadily since
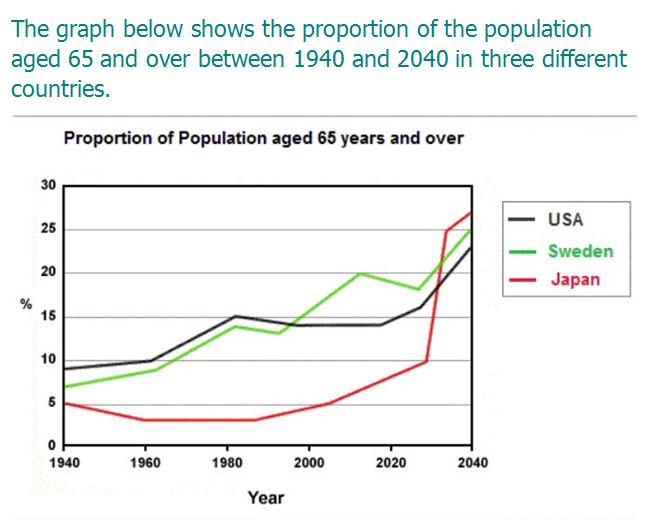
Band 5.0 Sample: The graph below shows the proportion of the population aged 65 and
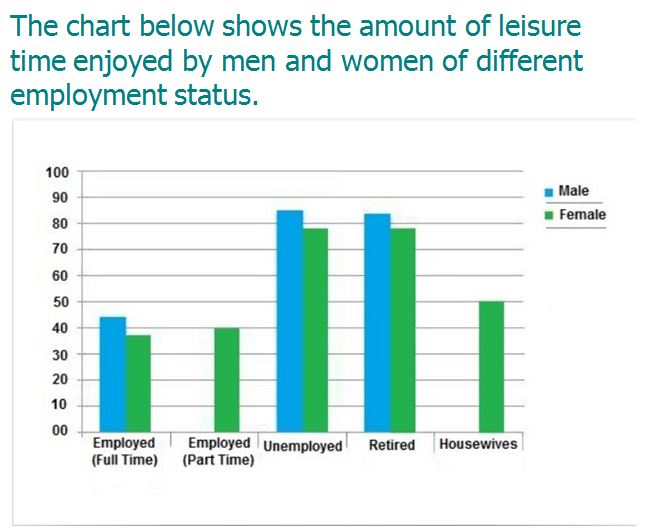
Band 4.5 Sample: The chart below shows the amount of leisure time enjoyed by men

Band 7 Sample: The three pie charts below show the changes in annual spending by
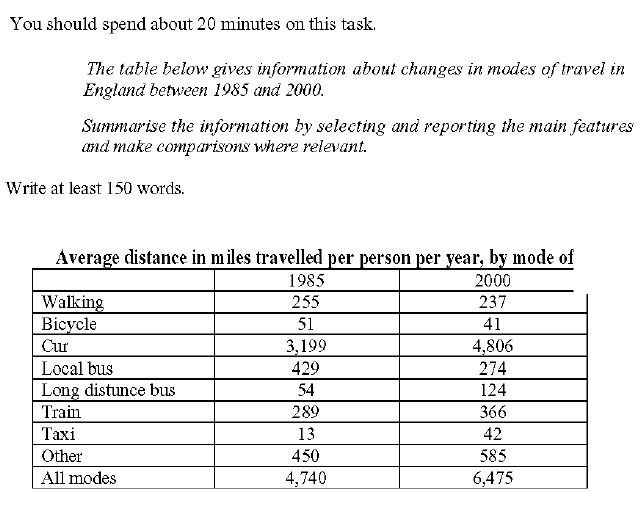
Band 7 Sample: The table below gives information about changes in modes of travel in
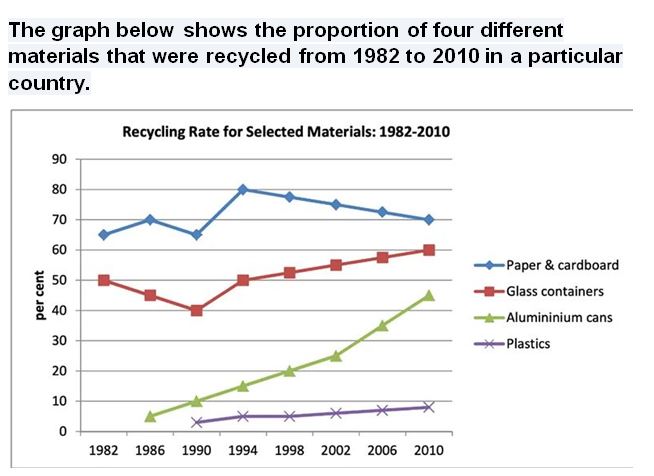
Band 5.0 Sample: The graph below shows the proportion of four different materials that were
You cannot copy content of this page