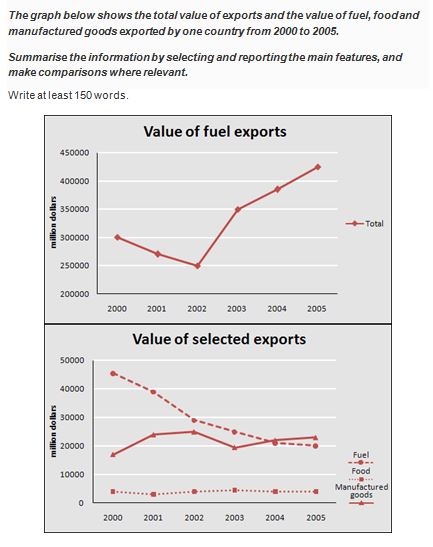
Band Sample 5.5: The graph below shows the total value exports and the value of
Band Sample 5.5: The graph below shows the total value exports and the value of fuel…
IELTS Writing Task 1 is very important part of the IELTS Exam. It has Seven types which are Bar Chart, Line Graph, Table, Pie Chart, Process Diagram, Map and Multiple Graphs.
Here, students are supposed to detail the trends and other aspects which is essential part of the whole Paper. These Questions are very easy. They are for to check the understanding of the students.
Apart from this, emphasis is laid on the grammar and the lexical aspects of the answers. Moreover, the cohesion which is very important for the writing module of IELTS Exam is given most priority and attention.
IELTS Writing Task 1
Band Sample 5.5: The graph below shows the total value exports and the value of
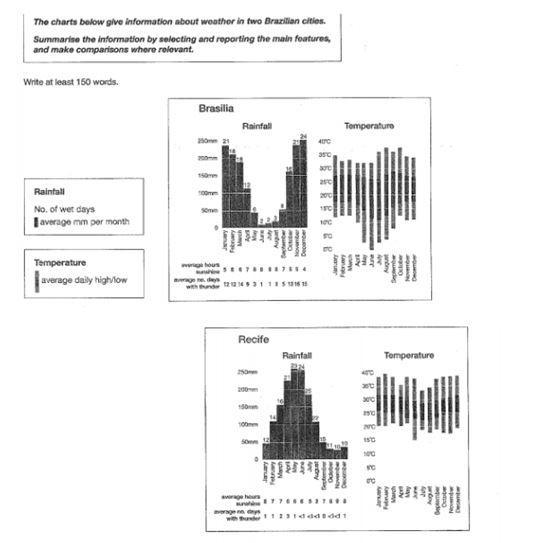
Band Sample 6.0: The charts below give information about weather in two Brazilian cities. The
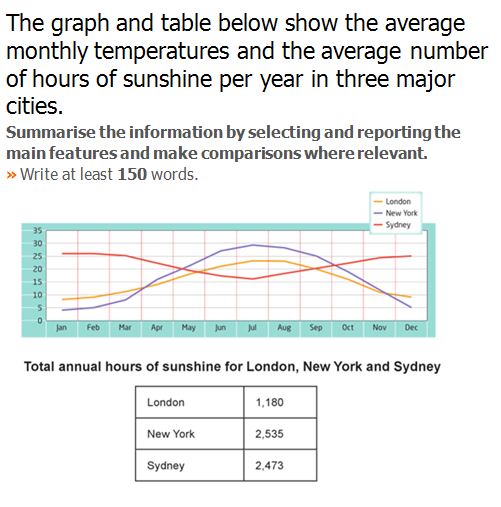
Band Sample 5.0: The graph and table below show the average monthly temperatures and the

Band Sample 4.5: The table below shows sales made by a coffee shop in an
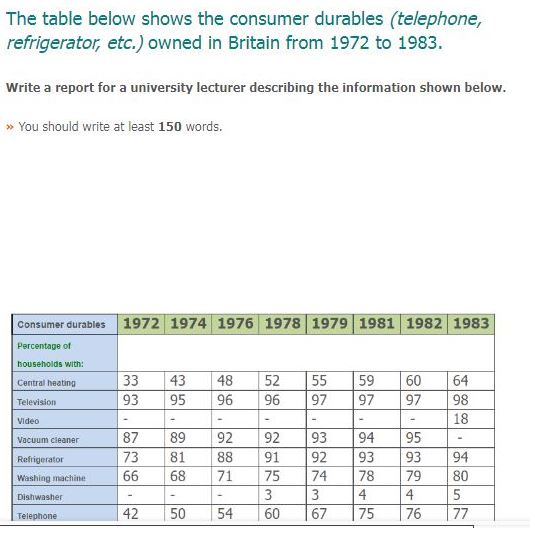
Band Sample 3.5: The table below shows the consumer durables (telephone, refrigerator, etc.) owned in

Band Sample 4.5: The graph below shows the consumption of fish and some different kinds

Band Sample 4.5: The bar chart below shows the percentage of Australian men and women

Band Sample5.0 : The charts below show the percentage of food budget the average family
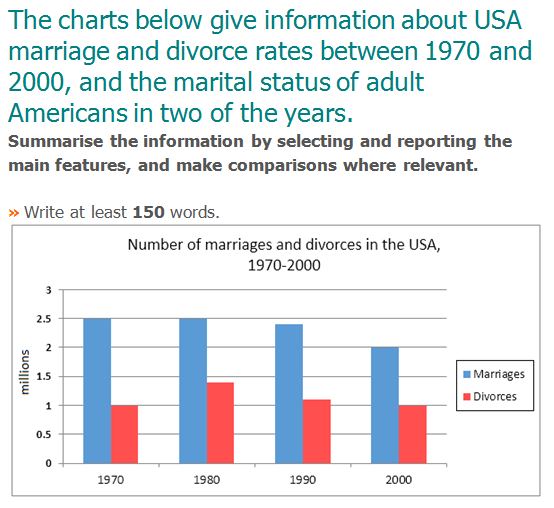
Band Sample 5: The charts below give information about USA marriage and divorce rates between

Band Sample 6: The pie charts below show units of electricity production by fuel source
You cannot copy content of this page