Band 6.5 Sample: The graph below shows the number of tourists visiting a particular Caribbean
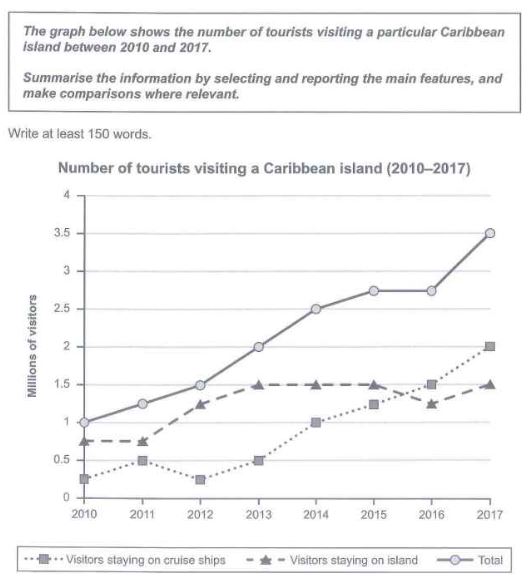
Band 6.5 Sample: The graph below shows the number of tourists visiting a particular Caribbean island between 2010 and 2017.
IELTS Writing Task 1 Cambridge.
Writing Module is very important for the preparation of the ielts exam. It consist of Task 1 and Task 2. The criteria for the checking of writing task are task achievement, coherence and cohesion, lexical resource and grammatical range and accuracy.
Here in this article, all the task 1 from the Cambridge books are given with solved sample answers. All the tricks and tips to the write the task 1 of the writing module are given. With proper paraphrasing and overall statement. The proper division of the content in BP 1 and BP 2 is present.
IELTS Writing Task 1 Cambridge.
Band 6.5 Sample: The graph below shows the number of tourists visiting a particular Caribbean

Band 6.5 Sample: The maps below show the village of Stoke ford in 1930 and

Band 6.5 Sample: The diagram below shows the life cycle of a honey bee. Paraphrasing

Band 6.5 Sample: The two maps below show road access to a city hospital in

Band 6.0 Sample: The graph and table below give information about water use worldwide and

Band 5.5 Sample: The charts below show the number of Japanese tourists travelling abroad between

Band 5.5 Sample: The chart below shows the different levels of post-school qualifications in Australia

Band 5.5 Sample: The three pie charts below show the changes in annual spending by

Band 5.5 Sample: The graph below shows the unemployment rates in the US and Japan

Band 6 Sample: The diagram illustrates the Life Cycle process of frogs in a pond.
You cannot copy content of this page