Band 6.0 Sample: The table below gives information about the underground railway systems in the
Band 6.0 Sample: The table below gives information about the underground railway systems in the six cities.

IELTS Writing Task 1 tips
Writing Module is very important for the ielts preparation. Many students find it difficult to score good in writing task. They find difficulty in forming correct sentence structure. They find it difficult to interpret the data and keep sentence structure correct.
So in this article, all the tips and tricks are given for the better performance of the students. They can learn everything about the task 1 and can improve their band scores. Proper explanation of the paraphrasing and proper format of the overall statement is given. All the possible solved sample papers are of the task 1.
IELTS Writing Task 1 tips.

Band 6.0 Sample: The table below gives information about the underground railway systems in the

Band 5.0 Sample: The graph below shows the proportion of the population aged 65 and

Band 5.0 Sample: The charts below show the number of Japanese tourists travelling abroad between
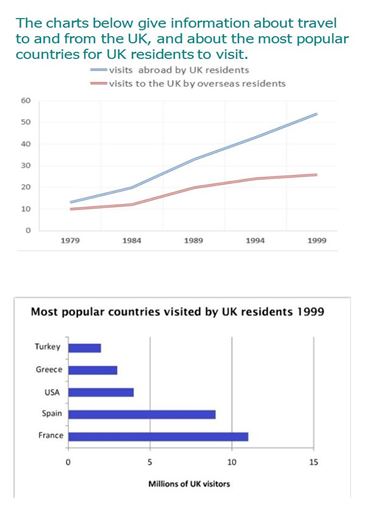
Band 5.5 Sample: The charts below give information about travel to and from the UK,
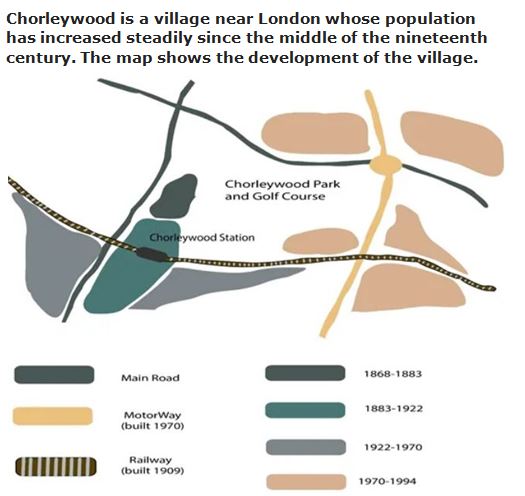
Band 5.0 Sample: Chorleywood is a village near London whose population has increased steadily since
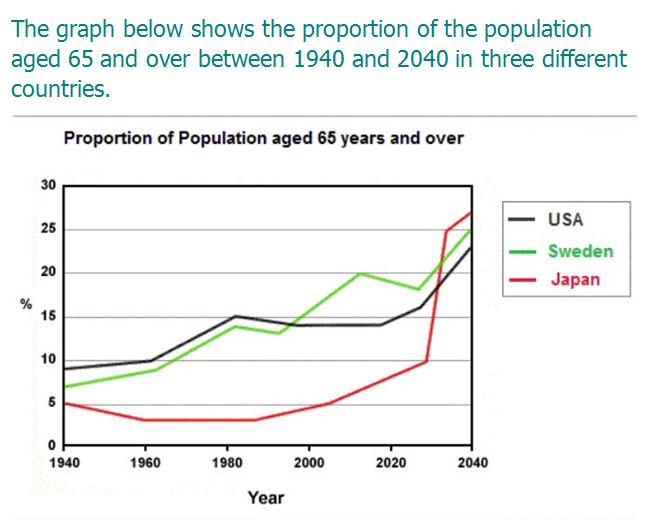
Band 5.0 Sample: The graph below shows the proportion of the population aged 65 and
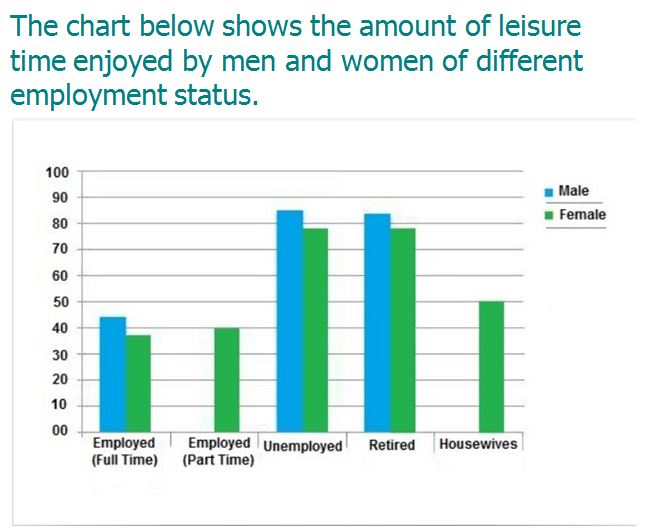
Band 4.5 Sample: The chart below shows the amount of leisure time enjoyed by men

Band 7 Sample: The three pie charts below show the changes in annual spending by
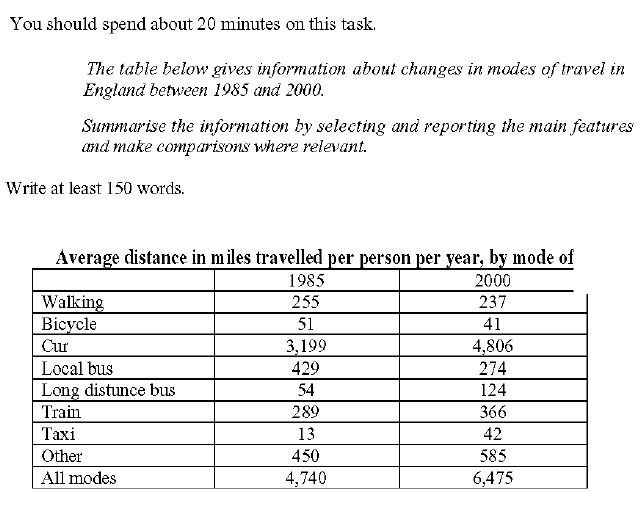
Band 7 Sample: The table below gives information about changes in modes of travel in
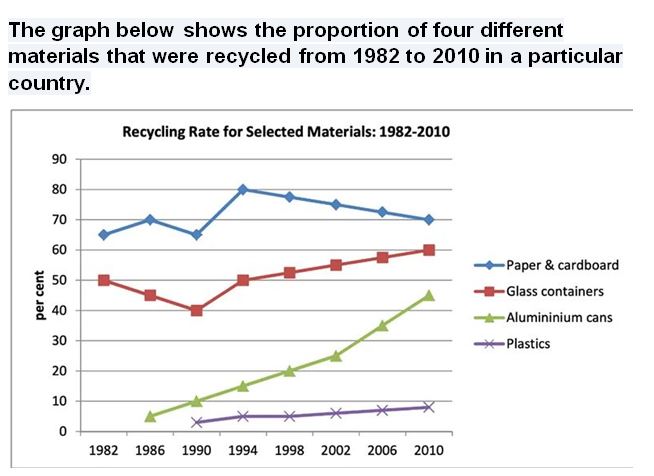
Band 5.0 Sample: The graph below shows the proportion of four different materials that were
You cannot copy content of this page