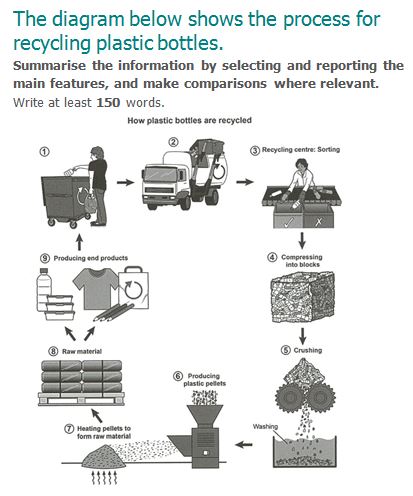
Band 5 Sample: The diagram below shows the process for recycling plastic bottles. Paraphrasing Statement:
Band 5 Sample: The diagram below shows the process for recycling plastic bottles.
IELTS Writing Task 1 Bar Graph samples
Writing Module is the most important task for the preparation of the IELTS exam. It consist of 2 tasks. The writing task 1 and writing task 2. The duration of the writing task 1 is 20 minutes. It consist of data interpretation.
The bar graph is one of the data interpreting task of task 1. In this, bar graphs are given along with the information. Students have to assemble the information and have to write 150 t0 170 about it. The bars can be vertical as well as horizontal.
IELTS Writing Task 1 Bar Graph samples.
Band 5 Sample: The diagram below shows the process for recycling plastic bottles. Paraphrasing Statement:

Band 5.5 Sample: The graph below shows the demand for electricity in England during typical

Band 5 Sample: The maps below show the centre of a small town called Islip

Band 6.5 Sample : The chart below shows the amount of money per week spent

Band 5.5 Sample: The diagram below shows the manufacturing process for making sugar from sugar
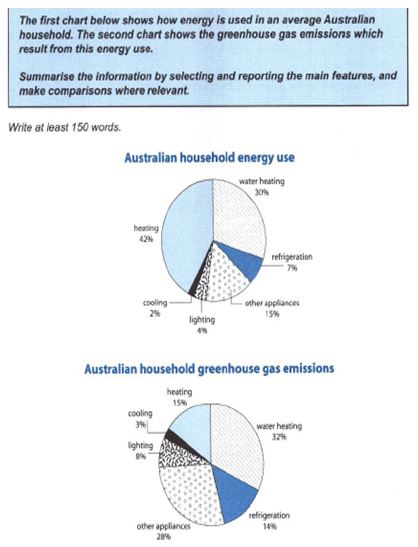
Band 5.5 Sample: The first chart below shows how energy is used in an average
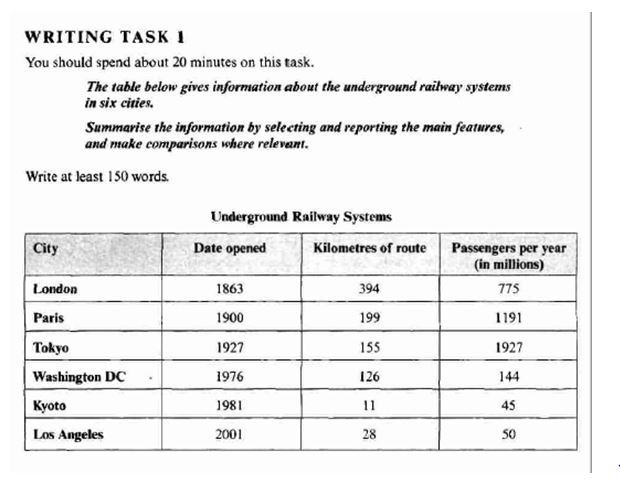
Band 6.0 Sample: The table below gives information about the underground railway systems in the

Band 5.0 Sample: The graph below shows the proportion of the population aged 65 and
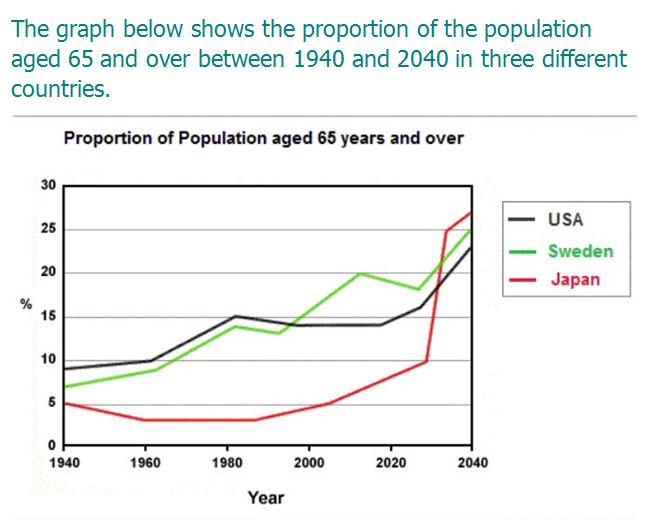
Band 5.0 Sample: The graph below shows the proportion of the population aged 65 and
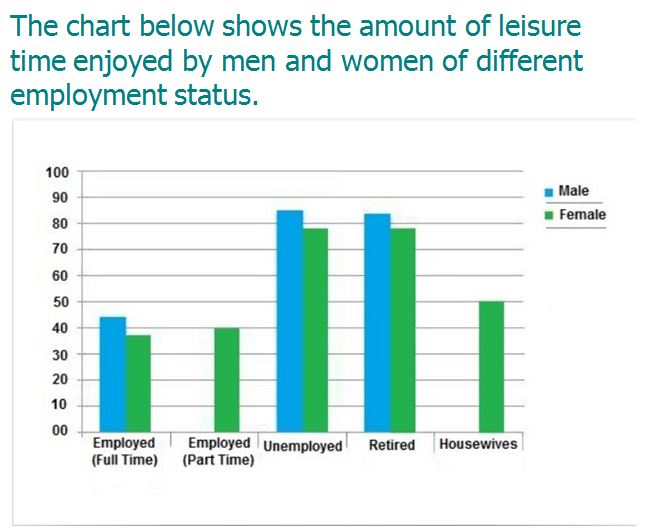
Band 4.5 Sample: The chart below shows the amount of leisure time enjoyed by men
You cannot copy content of this page