Band Sample 5.0: The table below shows the figures for imprisonment in five countries between
Band Sample 5.0: The table below shows the figures for…

IELTS Writing Task 1 Bar Graph samples
Writing Module is the most important task for the preparation of the IELTS exam. It consist of 2 tasks. The writing task 1 and writing task 2. The duration of the writing task 1 is 20 minutes. It consist of data interpretation.
The bar graph is one of the data interpreting task of task 1. In this, bar graphs are given along with the information. Students have to assemble the information and have to write 150 t0 170 about it. The bars can be vertical as well as horizontal.
IELTS Writing Task 1 Bar Graph samples.
Band Sample 5.0: The table below shows the figures for imprisonment in five countries between
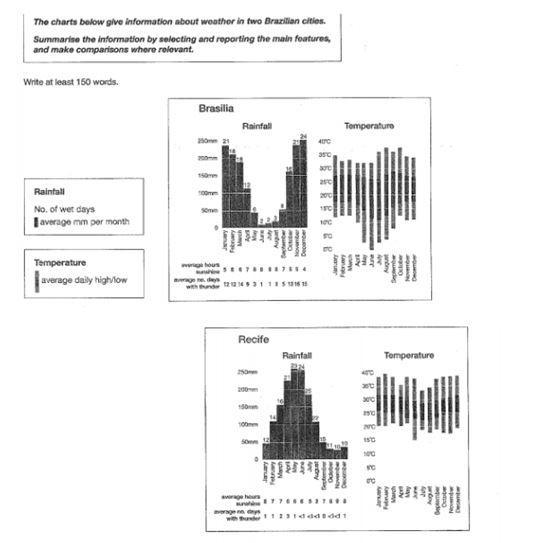
Band Sample 6.0: The charts below give information about weather in two Brazilian cities. The
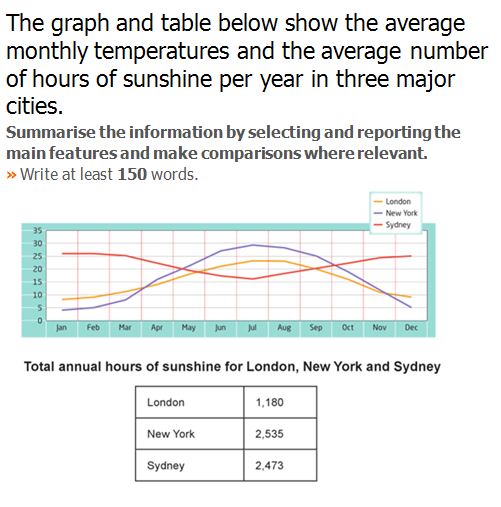
Band Sample 5.0: The graph and table below show the average monthly temperatures and the

Band Sample 4.5: The graph below shows the consumption of fish and some different kinds

Band Sample 4.5: The bar chart below shows the percentage of Australian men and women
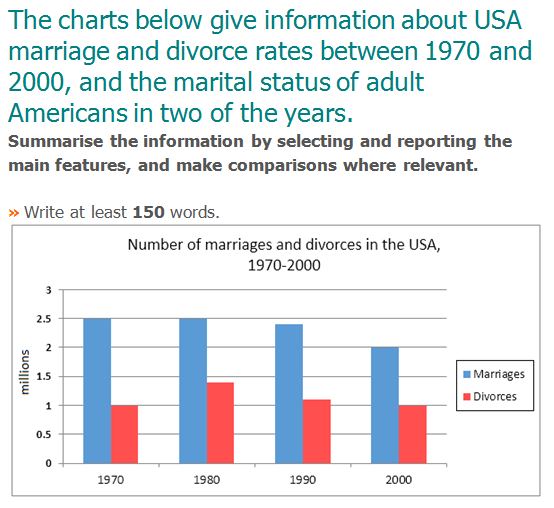
Band Sample 5: The charts below give information about USA marriage and divorce rates between

Band Sample 5: The graph below shows annual water usage(in millions of cubic meters) by
Band 4.0 Sample: The Table below shows the figures for imprisonment in five countries between

Band 5.5 Sample: The bar charts below show the percentages of men and women in

Band 4.5 Sample: The charts below show the results…of a survey of adult education. The
You cannot copy content of this page