Some people say that it is possible to tell a lot about a person’s culture
Some people say that it is possible to tell a lot about a person’s culture and character from their choices of clothes.

IELTS Writing Task 1 Line Graph.
Writing task 1 is consist of data interpretation. It is of various types, Bar graphs, Line graphs, Multiple Graphs, Pie charts and Table.
In line graph, various lines are given, representing the different data. The lines can be straight or curved. Students have to understand it and write a report on it. It is very useful for the beginners as well as other students. Students can get idea about the task.
Here, in the article, students can get idea of paraphrasing the statement and overall statement. Moreover, students can get idea about the division of data which is to be written in BP1 and BP2.
IELTS Writing Task 1 Line Graph.
Some people say that it is possible to tell a lot about a person’s culture

Band 8 Sample: The graph below gives information from a 2008 report about consumption of

Band 7.0 Sample: The graph below shows the demand for electricity in England during typical

Band 7 Sample: The graph below shows the average monthly change in the prices of

Band 7 Sample: The graph below gives the information about the percentage of the population

Band 6.5 Sample: The chart shows the number of shops that closed and

Band 6.5 Sample:The charts below give information about travel to and from the UK, and

Band 6.5 Sample: The chart below shows the changes that took place in three different
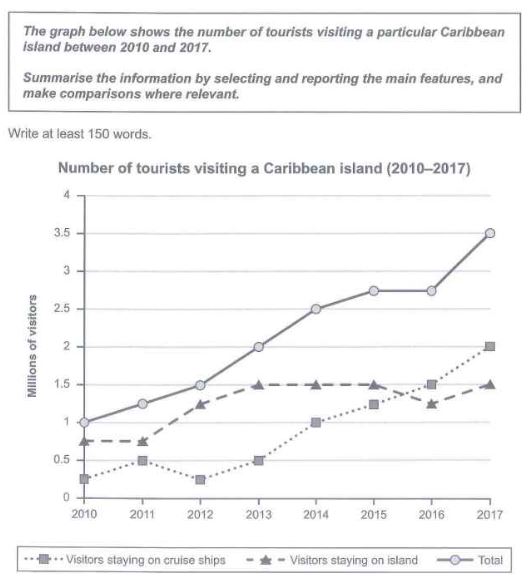
Band 6.5 Sample: The graph below shows the number of tourists visiting a particular Caribbean

Band 6.0 Sample: The graph and table below give information about water use worldwide and
You cannot copy content of this page