Band 5.5 Sample: The first chart below shows how energy is used in an average
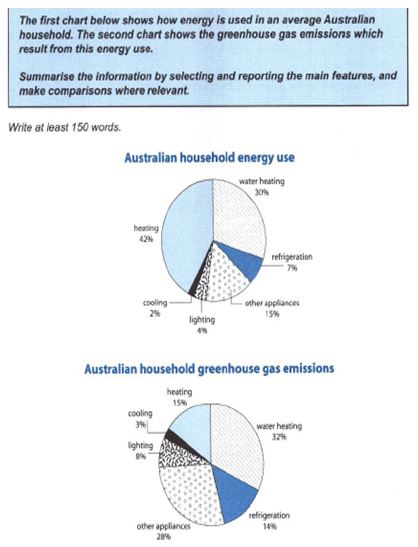
Band 5.5 Sample: The first chart below shows how energy is used in an average Australian household. The second chart shows the greenhouse gas emissions which result from this energy use.