Band Sample 5: The graph below shows annual water usage(in millions of cubic meters) by
Band Sample 5: The graph below shows annual water usage….

IELTS Writing Task 1 is very important part of the IELTS Exam. It has Seven types which are Bar Chart, Line Graph, Table, Pie Chart, Process Diagram, Map and Multiple Graphs.
Here, students are supposed to detail the trends and other aspects which is essential part of the whole Paper. These Questions are very easy. They are for to check the understanding of the students.
Apart from this, emphasis is laid on the grammar and the lexical aspects of the answers. Moreover, the cohesion which is very important for the writing module of IELTS Exam is given most priority and attention.
IELTS Writing Task 1
Band Sample 5: The graph below shows annual water usage(in millions of cubic meters) by

Band 4.0 Sample: The Table below shows the figures for imprisonment in five countries between

Band 5.0: The charts below give information on the ages of the populations of Yemen and Italy

Band 5.0: The graph below shows the demand for electricity in England during typical days

Band 5.5 Sample: The bar charts below show the percentages of men and women in

Band 4.5 Sample: The charts below show the results…of a survey of adult education. The

Band 5 Sample Answer: The table below shows social and economic indicators for four countries
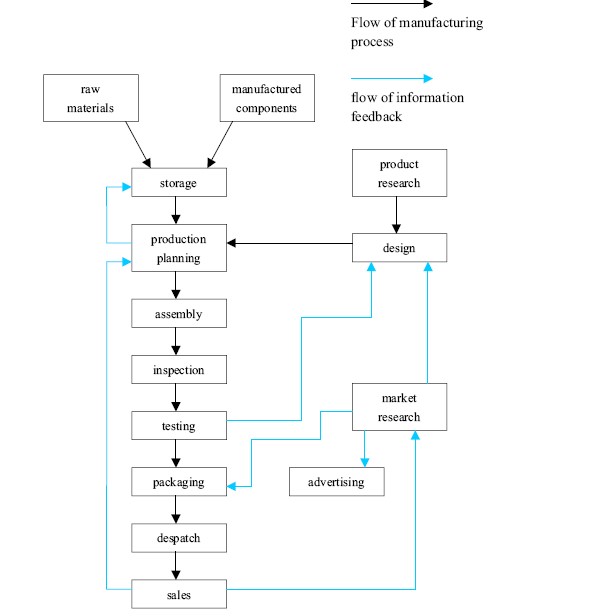
Band 5 Sample Answer: The diagram below shows the typical stages of consumer goods manufacturing,

Band 4.5 Sample Answer: Eating sweet foods produces acid in the mouth, which can cause

Band 5 Sample Answer: The graphs below show the types of music albums purchased by
You cannot copy content of this page