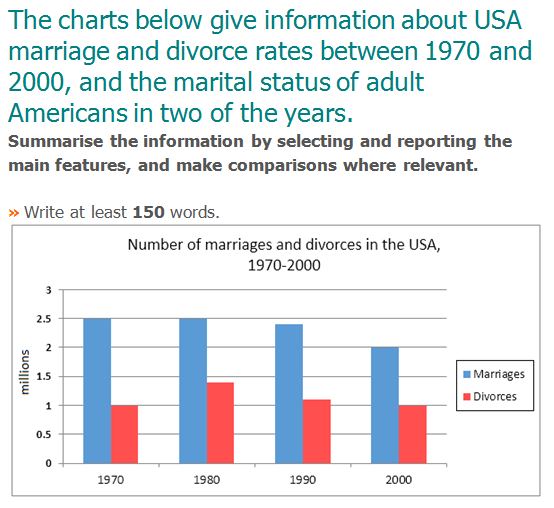
Band Sample 5: The charts below give information about USA marriage and divorce rates between
Tag: IELTS Writing Task 1 tips
IELTS Writing Task 1 tips
Writing Module is very important for the ielts preparation. Many students find it difficult to score good in writing task. They find difficulty in forming correct sentence structure. They find it difficult to interpret the data and keep sentence structure correct.
So in this article, all the tips and tricks are given for the better performance of the students. They can learn everything about the task 1 and can improve their band scores. Proper explanation of the paraphrasing and proper format of the overall statement is given. All the possible solved sample papers are of the task 1.
IELTS Writing Task 1 tips.
Band Sample 6: The pie charts below show units of electricity…
Band Sample 6: The pie charts below show units of electricity production by fuel source
Band Sample 5: The graph below shows annual water usage….
Band Sample 5: The graph below shows annual water usage(in millions of cubic meters) by
Band 4.0 Sample: The Table below shows the figures for…
Band 4.0 Sample: The Table below shows the figures for imprisonment in five countries between
Band 5.0: The charts below give information on the ages…
Band 5.0: The charts below give information on the ages of theĀ populationsĀ of Yemen and Italy
Band 5.0: The graph below shows the demand for electricity…
Band 5.0: The graph below shows the demand for electricity in England during typical days
Band 5.5 Sample: The bar charts below show the percentages of…
Band 5.5 Sample: The bar charts below show the percentages of men and women in
Band 4.5 Sample: The charts below show the results…
Band 4.5 Sample: The charts below show the results…of a survey of adult education. The
Band 5 Sample Answer: The table below shows social and…
Band 5 Sample Answer: The table below shows social and economic indicators for four countries
Band 5 Sample Answer: The diagram below shows the typical…
Band 5 Sample Answer: The diagram below shows the typical stages of consumer goods manufacturing,